
At the July 17 City Council Work Session, Mayor Duman stated (mark 1:39:34)
“The numbers are pretty impressive. When you take Ag land, conservation land, and then put parks and open space with it, it is 82% of our land mass. I mean that’s, I mean that’s…anyway, I knew it was a lot, but that is, that is a lot. To say we have 82% in Ag, conservation, and in parks.”
That does sound like a lot, but is it true? Who is checking the data coming out of the Planning Department.
Mayor Duman is referring to the data presented by the Planning Department earlier in the work session. Keith Cannady presented the Pie Chart below with the breakdown of Land Use type. The purpose of this was to show how much land in Suffolk is still ‘rural’ (that is agricultural land, conservation, with parks & open space).
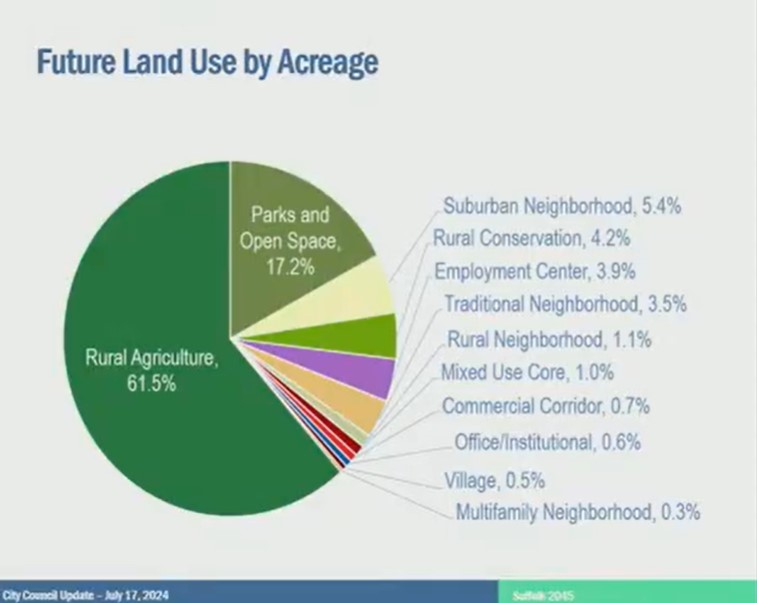
Adding those numbers up you get 83% making it look like Suffolk still has a lot of green space. That is what Mayor Duman was referencing in his quote.
We made a FOIA (Freedom of Information Act) request of the City for the areas that those percentages are based on. We received this typed-up sheet in response (Full document is available as a pdf at the end of this article).
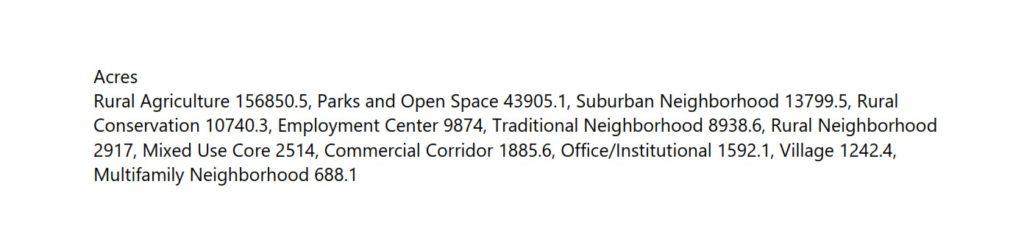
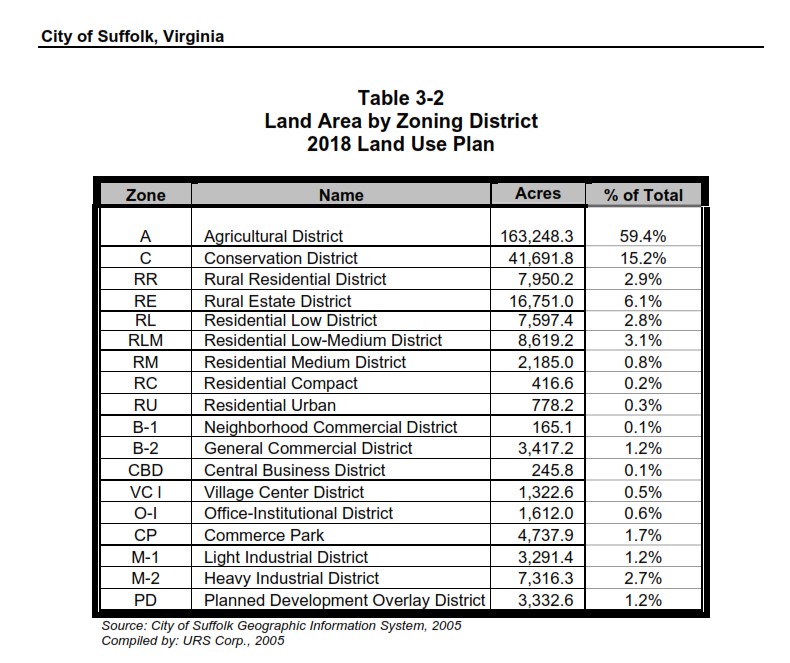
These numbers do in fact tally up to the percentages in the pie chart, but the question is, where did they come from? We dug a little deeper to find some other numbers from the City regarding Land Use. In the Suffolk 2026 Comprehensive Plan (adopted in 2006), Table 3-2 on page labeled 3-7 (page 37 of document), lists Land Use data from 2005, with the source being the City of Suffolk, Geographic Information Systems compiled by URS Corp in 2005.
The two sets of data were in very different formats, so we combined them into a chart to make a comparison easier. Land Uses/Zoning were placed beside comparable Land Use (the City changes categories with comprehensive plans, but they provide corresponding zoning and land uses categories.)
We noticed right away that the City used a different Total Area for the City of Suffolk in its Pie Chart numbers. The 2005 data uses 429.2 square miles (430 square miles is the generally accepted amount of area in Suffolk), while the recent 2024 data has 388.4 square miles. The amount of water in Suffolk is roughly 30 square miles, and since this is about Land Use, it seems appropriate that it was left out. That left us with balancing the total areas so that we can compare percentages. We did this by subtracting the difference between two total areas in the two data sets and then subtracting that difference from the 2005 data in the Conservation category (because that is the category the water area would fall under). It wouldn’t make any sense that the City removed 40-ish square miles from any other land use category (Suffolk has not shrunk in the last 20 years!), so this felt like a safe assumption. Now the Total Land Area of Suffolk is equal between both data sets.
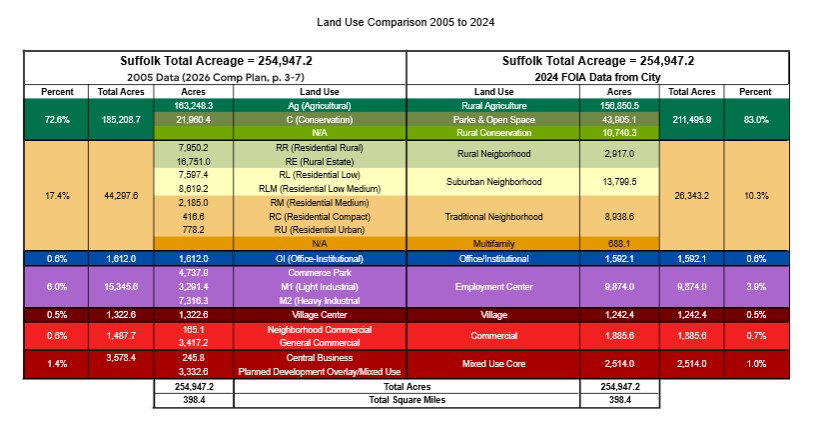
Chart created by Care4Suffolk to compare data provided by the City of Suffolk in 2005 and 2024.
The chart is split into two sides with the 2005 data on the left and 2024 data on the right. The colors used match the 2045 Comprehensive Plan Land Use Categories to make it easier to compare and find corresponding areas on the Land Use Map. Some categories have been combined, but these are noted in the 2045 Comp Plan.
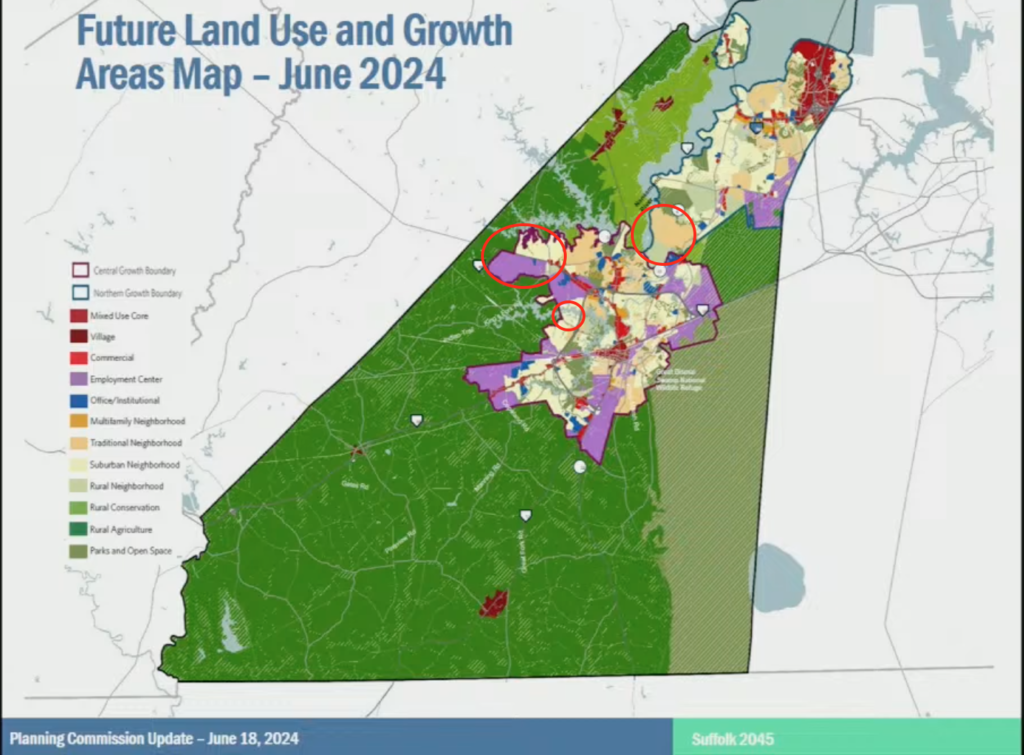
This slide is from the Planning Commission Meeting on June 18, 2024. We have circled the new Growth Areas in red to highlight them, since the City did not have any way to distinguish the current Growth Areas from Future Growth Areas.
Now, let’s dig into some of these numbers on that chart. If you look at the area in acres, you will notice that in the last two decades, Suffolk has managed to increase its green space (ag land, conservation, and parks) by more than 26,000 acres, all while decreasing commercial area (by 660 acres), industrial area (by 5,500 acres), and residential land use by a whopping 18,000 acres!
If you have lived in Suffolk for even part of that time, you might be asking yourself: HOW? How has the City of Suffolk, that consistently gets ranked as one of the faster growing cities in Virginia, managed to DECREASE the amount of land use for these land use categories while still maintaining huge growth. It defies belief.
The only reasonable explanation is that one of the data sets has incorrect data. The 2005 data is properly sourced and published in the 2026 Comprehensive Plan, while the 2024 data that was presented at City Council, and when pressed for the area (with the FOIA request), was just a typed up document with no source provided. So that begs the question, where did this data even come from?
This is not the first data that the City staff has presented data that doesn’t make sense. The Planning Department has stated multiple times that the Employment Centers category (where warehouses can be built) is only a 14% increase in area compared to current industrial areas. Here are the side-by-side map comparison:
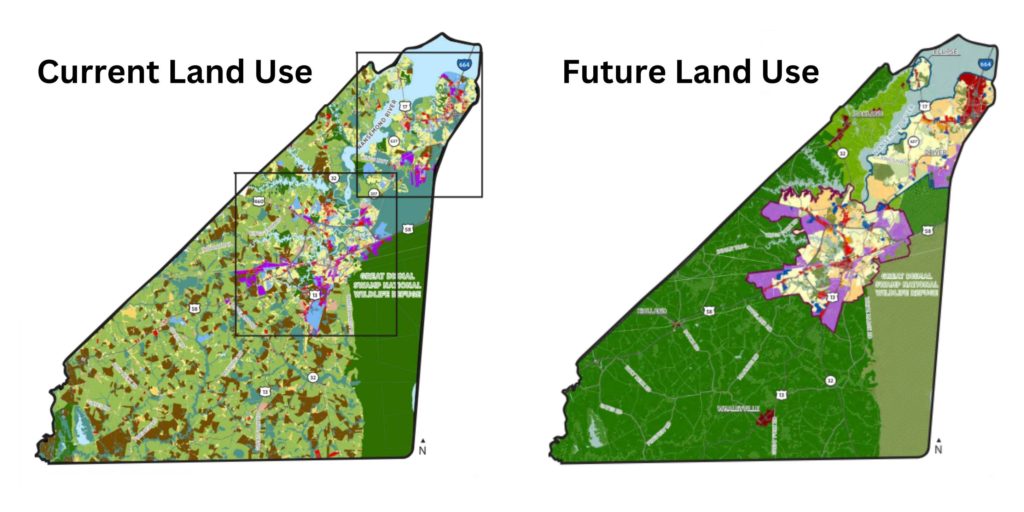
The purple areas on both maps represent where warehouses can be built. The left side is current land use and the right side is what will be if the 2045 comp plan is approved. Of course the City doesn’t provide area numbers, they just state that it is a 14% increase. Does the purple on the right look like a slight 14% increase? Not even close! It looks to be more than double the current purple area (maybe even triple – that is a LOT of purple). Is this just like the City stating that Suffolk has 83% of its land as green space? What is the real measure of that green space? We know that in 2005, it was less than 73% and the growth in the City has been historically huge! Are we even at 50% any more? We have no idea, but the important point is neither does the City!
City Council is about to vote on the 2045 Comprehensive Plan in a few short weeks. They are basing their decision in large part by the data that the City’s Planning Department is providing them. But where is this data coming from? If this information is wrong, what else is wrong? We already know that the City staff choose NOT to have the Fiscal Impact Analysis done as was originally required with this new comprehensive plan. The City staff also have postponed the Master Transportation Plan until some unspecified date in the future. Both of these would have provided a tremendous amount of data to evaluate this plan. The City also used traffic data gathered during the pandemic (when schools went online, many businesses had work from home – so this was NOT typical of traffic patterns!) When the Planning Department presents information like this to City Council and the Public, the data has to be accurate. Decisions for our future are based on this data. What other previous decisions have been based on bad data?
This plan ignored public input, and now we find that City staff have been using bad data to frame the argument in favor of this plan. City Council needs to say no to this Comprehensive Plan. This is unacceptable and the citizens of Suffolk deserve better.
Please sign our petition and share with family, friends and neighbors in Suffolk.
Documentation:
Youtube Video for July 17 City Council Work Session
FOIA response from Suffolk regarding the acreage from slide show presentation